9 Key Accounts Receivable KPIs and Metrics For Managing A/R

9 Key Accounts Receivable KPIs and Metrics For Managing A/R

Understanding DSO, DDO, and Other Accounts Receivable KPIs
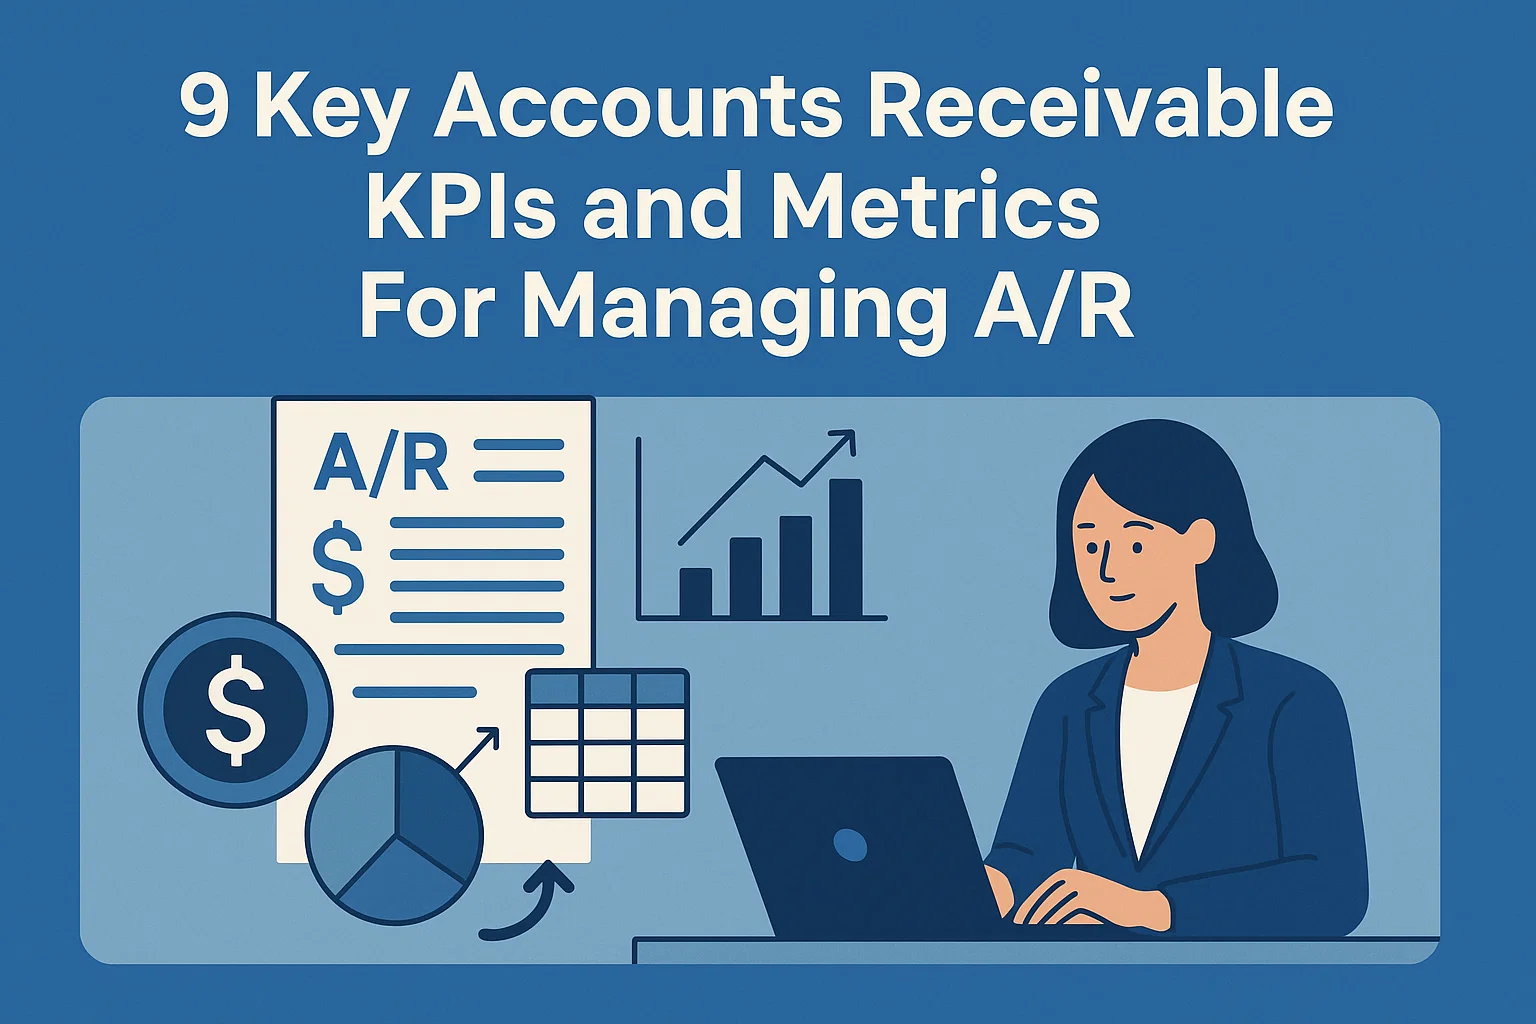
A/R turnover – the credit-to-cash cycle – and working capital are critical to your business, so it is essential to monitor the Key Performance Indicators (KPIs) and other metrics that track your company’s credit, collections, and deduction management health.

In addition, businesses have become more complex, so receivable performance analytics are essential to keep track of the financial health of your receivables.

Here are the key metrics to implement.

1. Days Sales Outstanding (DSO) and Best Possible DSO (BPDSO)

Standard DSO is the metric for tracking the effectiveness of Invoice Collection Management. That is, how long it takes to collect payments based on the invoice date, intending to reduce your DSO to as close as possible to your average terms of sale (the “Best Possible DSO” or “Best DSO”). Depending on the industry and seasonality, DSO calculations can get complicated.

However, for a simple example, suppose that your AR totals $1,600,000, and Credit Sales for the last twelve months were $10,200,000, the formula would be

DSO = Total A/R ÷ Total Credit Sales X 365, and the answer a DSO of 57.2 days.

Best Possible DSO uses only your current (not yet past due) receivables and tells you what your best “on-time payment” turnaround could be.

Best Possible DSO = Current A/R ÷ Total Credit Sales x 365. Using the above numbers, if your Current A/R is $800,000, your Best Possible DSO comes out to 28.

In this case, you have a lot of potential for improvement between the Standard DSO of 57 Days and the Best Possible DSO of 28.

Working towards a DSO that is as close as possible to your Best Possible DSO should be the goal of your department to have a healthy cash flow and ensure your AR management is as efficient as possible.

Once you start calculating the DSO and Best DSO, create monthly targets that “move towards” the Best DSO. It’s unlikely you’ll achieve perfection, so make strides to reduce the metric over a 3-6 month period.

2. Average Days Delinquent (ADD)

ADD is how many days on average payments are overdue and can be a warning sign of problems. If the number is high, you must determine whether your systems, collections, and invoice processes need improvement. ADD is calculated as the DSO minus your actual (average) terms.

For example, with the hypothetical company above in #1, the ADD would be ten days on September 30. Say one year later the ADD is 15 days, which may mean your processes may be falling behind.

Over time, measuring ADD and DSO will show you whether you are improving, static, or falling behind.

3. Accounts Receivable Turnover Ratio (ART)

ART measures how effectively you collect your revenues as an annual broad benchmark. It is determined by taking your net credit sales and dividing it by your average accounts receivable balance. When the ratio is higher, you turn A/R into cash more quickly, thus improving your working capital, cash flow, and liquidity.

A low ratio can mean it is time to reconsider credit and collection procedures and to add collection automation.

The calculation is ART = net credit sales ÷ average accounts receivable. Using an example of $15,000,000 sales per year ÷ average AR of $2,200,000 = 6.8 ART or, in another case, $15,000,000 sales ÷ average AR of $3,200,000 = 4.7 ART (worse).

4. Collection Effectiveness Index (CEI)

ART measures how often accounts receivable turn over, but CEI measures how effective you are at collecting all outstanding money in a specific period (usually measured over one year). CEI is calculated as CEI = (beginning A/R + monthly credit sales – ending total A/R) ÷ (all beginning receivables + monthly credit sales – ending current receivables) x 100.

5. Deduction Days Outstanding (DDO)

By dollars: Track Customer Deduction Management results separately from invoice collection, using Deduction Days Outstdanind as the KPI. Similar to how you calculate Days Sales Outstanding (DSO) for invoice collections, add the average daily deductions amounts received during a period (say 90 days), and divide the total outstanding deductions by the average per day. For example, if deductions at the end of a month total $1,000,000 and you receive an average of $25,000 per day, the DDO = 40 days.

By the number of deductions: Another way to think about DDO is to use the number of unresolved deductions since the usual DDO metric often looks better than it actually is because of the operational focus on large dollar items. Using this method, if deductions at month-end total 6,000 items and you receive an average of 100 deductions per day, the DDO = 60 days.

6. Deduction Effectiveness Index (DEI) New

The A/R department spends so much labor and expense (often 75% of the A/R resources) in deduction management to discover the root causes of errors, find the improper deductions, and ultimately get your money back. 

We employ what we named the DEI metric as a critical KPI to track how we are doing. To determine the DEI every month, compare the total deductions vs. the deductions found to be incorrect vs. the collected deductions. Do this by category (returns, shortages, discounts, trade promotions, etc.) and track your company’s progress.

Unfortunately, industry-peer data is not useful as company processes and policies differ. Hence, the best way to measure your success is to set internal baselines (where you are today) and work to improve from there.

Regular undisputed invoice receivables have an accepted metric of what percentage you should be collecting (i.e., 100% minus bad debts). For deductions, however, there is no objective metric for the percentage you should be recovering.

Therefore, an excellent way to determine if you are leaving profits on the table is to have unresolved customer deductions post-audited by an outside firm before writing them off.

7. Number of Invoicing Disputes

Mistakes are costly, so you should track, by reason, how many invoices have to be revised or credits issued due to billing or process errors. If the number is trending upward, it could mean that you have systemic problems in order entry, invoicing, or fulfillment, all of which will impact DSO and company profits.

8. Bad Debts to Sales Ratio

Measure bad debts as a percentage of revenues, but always look behind the number if you can and compare the credit losses against sales (i) gained due to more lax credit risk policies or (ii) lost due to overly restrictive corporate credit policies. Most high-risk credit decisions are intentional and logically decided, calculating that the extra revenues will offset potential losses.

9. Percentage of High-Risk Accounts

Doing business with high-risk customers is part of a business strategy. Do you have an excess of depreciating inventory? Do you need extra market penetration in a territory? Many industries are inherently “high-risk,” so the credit and sales managers are aligned and have to do what they can to offset the additional risk via credit instruments and, perhaps, terms or pricing.

Final Thoughts: How do you manage accounts receivable if you don’t measure receivable performance?

Monitoring your accounts receivable metrics and KPIs is essential to running a healthy business. You’ve collected valuable statistics, and now you need to see how you measure up.

First, of course, you’ll need to look at the historical performance within your organization, but that’s not enough. You also need to compare your performance to industry peers. With these comparisons, you’ll be able to share insights not only within Finance but with Sales and Marketing.

In today’s global, highly competitive economy, you must be on top of your game.


Related Articles

Search
Generic filters